2018 in review: analytic
Other parts of the 2018 review: reflections, state of the blog.
2017 review: analytic, narrative.
2016 review: analytic, narrative.
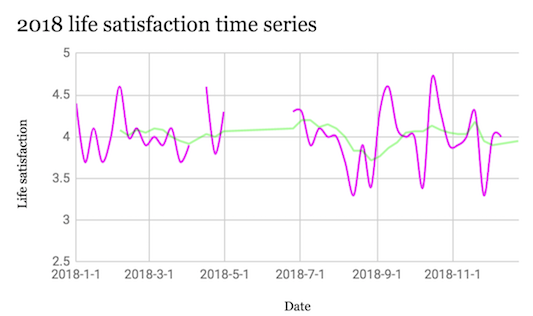
On a scale of 0 to 5 (5 high), my average life satisfaction in 2018 was 4.0. I subjectively assessed life satisfaction at the end of each day or near the beginning of the next day. My best days were 5/5, and my worst day was a 2/5.
The pink line is each week's average life satisfaction score; the green line is a 6-week rolling average. Essentially, my average life satisfaction oscillated between 3.5 and 4.5 over the course of the year, without a clear trend upwards or downwards.
I missed reporting for 9 weeks this year, because I was traveling & away from my computer. This is something of a confounder, though I don't recall being particularly dissatisfied during those times (if anything I think I was somewhat happier than usual), so these gaps probably wouldn't negatively impact the 2018 average if they were filled in.
My average mood in 2018 was 4.0, remarkably close to my average life satisfaction score (4.04 compared to 4.01, if we add a significant digit). I used the Reporter app to subjectively assess my mood about once a day at a random time. There was a similar closeness between in-the-moment mood & end-of-day life satisfaction reports in 2016 and 2017.
My average life satisfaction in 2017 was 3.8, so I'm up two notches this year. I'm not sure if this is a meaningful increase, or noise. I asked Gwern about this – they suggested running some complicated stuff in R to model it, which I don't have the inclination to do now (maybe next year!).
They also noted a wrinkle in interpreting this stuff:
One tricky part is the question of whether any change is a change in your actual latent life satisfaction, or simply your measurement.
Maybe you changed your standards, or you began to succumb to hedonic homeostasis, or simply began to have a harder time remembering how things used to be. Not something you can answer, unfortunately.
And this:
2 years is a long time for the two random walks to remain diverged.
If 2018 is consistently higher than 2017... +0.2, given that your [standard deviation] is probably something like 0.35, is a large effect.
The standard deviation for 2017 scores was 0.45, and for 2018 scores 0.33.
Squinting at this, I think it means my life satisfaction scores did in fact improve from 2018 compared to 2017. But it's hard to say whether that's due to a real increase in satisfaction or a change in how I'm relating to the metric.
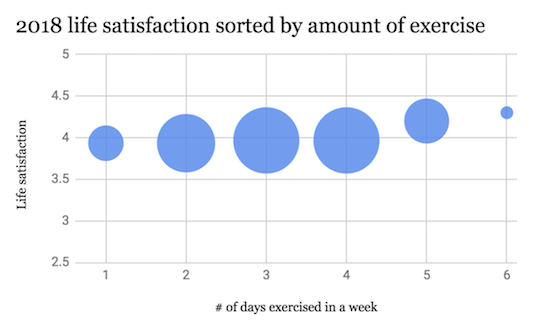
I exercised on 136 days in 2018 (roughly the same as 2017, when I exercised on 144 days).
Most weeks I exercised between 2 and 4 times. There doesn't appear to be much of a relationship between my life satisfaction score & the amount exercised that week. This is an update from last year, when I thought there might be a relationship between amount exercised & life satisfaction. I think this year's graph is a clearer way to think about the relationship.
Note that when I exercised 5-6 times/week my life satisfaction was a couple of notches higher (averages of 4.2 for 5x/week and 4.3 for 6x/week, compared to averages of ~4.0 for 2x-4x per week). I'm reluctant to attribute causality here, because there were only 6 weeks where I exercised 5+ times, and the flat trend from 2x-4x per week is so consistent. Maybe in 2019 I'll log many more intensive exercise weeks to see if there's anything to this.
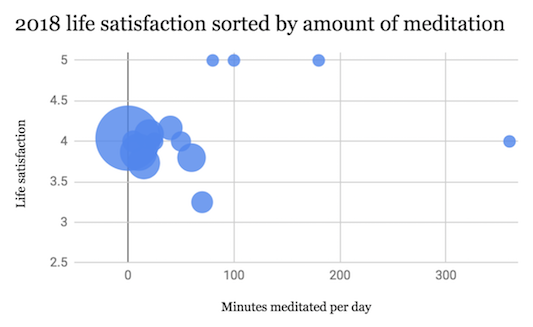
I meditated on 160 days in 2018. Halfway through the year, I decided it made more sense to track this as "number of minutes meditated" rather than as a binary, so the above graph only has data from June 2018 onward.
I'm not really sure what to make of these data. There doesn't seem to be a relationship between life satisfaction and meditation for any amount under an hour a day – they're all clustered around a score of 4.0 (my average).
This accords with some advice a teacher told me this year: he thinks that it takes roughly 25 to 30 minutes on the cushion for the mind to calm down & stop surfacing random thoughts. According to him, anything under 30 minutes/day just helps reduce stress (though I suppose stress reduction should show up in my life satisfaction score... maybe less than 30 minutes/day doesn't even yield a noticeable stress reduction benefit for me).
Anyway, above an hour per day, things get weird. Days where I sat for 70 minutes scored 3.3, quite a bit lower than my average. But then days where I sat for even longer tended to have higher-than-average scores: 80 minutes, 5.0; 100 minutes, 5.0; 180 minutes, 5.0; 360 minutes, 4.0.
Absent from my data is a six-day vipassana retreat I took at Spirit Rock in April. During this retreat I was meditating for more than 6+ hours a day. If sitting for longer than an hour a day (well, longer than 70 minutes/day) actually increases that day's life satisfaction score, we'd expect to those days to have high scores.
I don't have data from the retreat, but I do have data from immediately before & after. My average life satisfaction for the 14 days prior to the retreat was 3.8. And my average score for the 14 days following it was 4.2. So a delta of 0.4 – there's probably a real discontinuity here.
It's stronger if we look at just the seven days before & after – 3.9 in the week leading up to the retreat; 4.6 in the week after. A delta of 0.7! This matches my recollection of being in an afterglow during the week after the retreat.
I take all this as weak evidence that meditating for an hour or more each day improves my subjective experience (I think the 3.3-70 minutes result is probably noise as it only had 4 data points). This is an update from last year, where I basically didn't have enough data to conclude anything.
I still don't have a lot of data on the meditation-life satisfaction link. From what I do have, my guess is that sitting for less than an hour a day isn't particularly helpful, whereas sitting for more than an hour does improve life satisfaction somewhat (consider Harari who sits for two hours a day). This is a weakly held view – maybe I'll make a project out of producing more data in 2019.
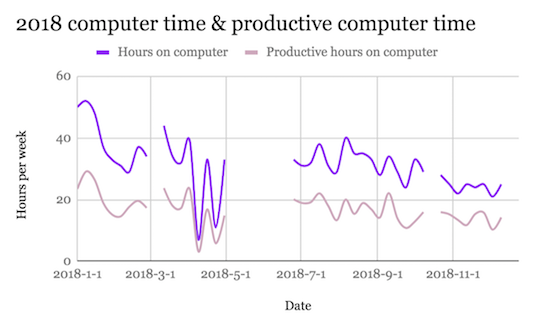
In 2018 I spent about 1293 hours on my computer (54 full days!). I spent an average of 32 hours a week (for the weeks when I was using my computer – I was away from my computer for roughly 9 weeks.
I tracked computer use with RescueTime. There were a couple of weeks (the small breaks in the chart above) when RescueTime wasn't working on my machine, so I didn't get data from those weeks. I also spent a bunch of time on my phone (about an hour per day, according to Moment) that isn't reflected in this graph.
Shout-out to Moment for helping me grow more intentional about how I relate to my phone, and for logging a bunch of terrifying stats (on average 8% of my waking life on my phone – yikes!). Also might as well plug trying your phone on grayscale while I'm on the topic.
My average computer-productivity in 2018 was 53% – about half the time I spent on my machine was "productive", according to RescueTime's criteria. This is a super messy measure – RescueTime's categorization is imperfect, and I think a lot of useful work can get done backstage when I'm goofing off online.
I'm not tracking computer time & computer productivity to achieve maximal efficacy. I'm more doing it to have a rough measure of what "productive" and "unproductive" days look like, and to remind myself that someone is watching when I'm wasting time.