Revisions to "Trump overvalued"
Note: Trump did in fact win majorities in all five states. I did a postmortem of this bet here.
A couple of revisions to my recent post on a Trump PredictIt market being overvalued.
1. Independence of primaries
In the post, I assumed that each primary was independent of the others:
It's safe to assume independence in this case because the five primaries (Connecticut, Delaware, Maryland, Pennsylvania, Rhode Island) will all occur at roughly the same time, in the same time zone. It would be unlikely for the result of one of these primaries to influence the result of another, so we will assume that there's no inter-primary influence.
This assumption is incorrect. I was understanding independence as "not being causally linked," but actually independence is a stronger criterion than that. Independence of events implies no correlation between the events (I asked about this on Cross Validated, and a helpful answer (a) pointed me to this simple proof of why correlation implies dependence (a).
It's pretty clear that the primaries are correlated (e.g. learning the result of one of the primaries would inform your guess about the likelihood of Trump winning the other primaries), so they are therefore dependent, even though they aren't causally connected. Given dependence, we can't calculate the conjunct probability by multiplying all the primary probabilities together. I.e., this method isn't valid:
p(Trump wins 50% in 5 states) =
p(Trump wins 50% in Connecticut) * p(Trump wins 50% in Delaware) *
p(Trump wins 50% in Maryland) * p(Trump wins 50% in Pennsylvania) *
p(Trump wins 50% in Rhode Island)
Unfortunately, I don't know a simple way of calculating the conjunct probability of multiple, dependent events that occur simultaneously. We could start with the probability of one 'seed' primary, condition on a Trump majority victory there to estimate the conditional probability of a Trump majority victory in the next primary, and so on. But that method is complicated, and I would be basically making up the conditional probabilities further down the tree.
Instead, I'm inclined to use the independent method of calculating the conjunct and add a (basically arbitrary) dependence discount to the resulting probability. This probably isn't theoretically sound, but it will give a rough read on what the conjunct probability is.
2. Incorporating 538's probability distributions
In its primary forecasts, 538 includes a visualized probability distributions for each candidate's chance of winning the primary.
Instead of estimating Trump's chance of winning the majority of the vote via a base rate (the method I favored in my previous post), we could eyeball these visualizations to estimate what percent of the probability mass is over the 50% threshold.
For example, let's take a look at the Maryland polls-plus distribution:
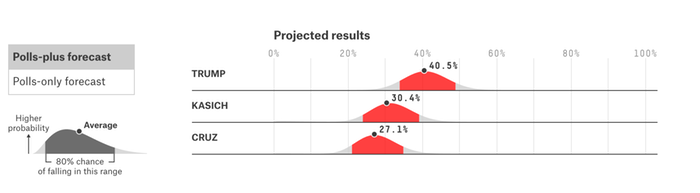
Looking at Trump's distribution, we see that roughly 8% of the probability mass lies past the 50% threshold (the red shading indicates 80% of the probability mass, centered, so the grey right-hand tail is 10% of the mass).
Doing this for the other states gives us:
p(Trump wins 50% in Pennsylvania) = 0.25
p(Trump wins 50% in Connecticut) = 0.95
There aren't 538 profiles of Delaware or Rhode Island, but given recent polling, let's adjust those estimates as well:
p(Trump wins 50% in Delaware) = 0.95
p(Trump wins 50% in Rhode Island) = 0.95
Note that these are much higher numbers than I previously estimated using a bumped-up base rate. A recent poll shows Trump taking 61% of the vote in Rhode Island, so I think we should expect Trump to take the majority there, and likely in Delaware as well.
Here are the probabilities given by the same method using polls-only estimation (which is more favorable to Trump):
p(Trump wins 50% in Maryland) = 0.20
p(Trump wins 50% in Pennsylvania) = 0.40
p(Trump wins 50% in Connecticut) = 0.98
p(Trump wins 50% in Delaware) = 0.95
p(Trump wins 50% in Rhode Island) = 0.95
3. Revised estimate of Trump winning majority victories in all five states
Let's estimate the conjunct again, using our revised probability estimates drawn from the 538 (polls-plus) data visualizations. We'll assume independence, and use a 3x fudge factor to account for dependence. This gives:
p(Trump wins 50% in 5 states) = (0.08 * 0.25 * 0.95 * 0.95 * 0.95) * 3 = 0.05
5%. Still substantially lower than PredictIt (which is at 27% as of this writing), but not negligible. Plus, I'm not confident that my 3x fudge factor for dependence is right – I very well should be using 4x or 5x, in which case PredictIt looks somewhat better.
My reservations about fudging for dependence notwithstanding, this is the best method for estimating this market I've encountered so far. I'll plan to use a similar methodology going forward.
Thanks to Howie Lempel for pointing out the independence issue and suggesting the use of 538's data visualizations to derive >50% win probabilities
[rereads: 3, edits: phrasing tweaks, fixed links, added a note]